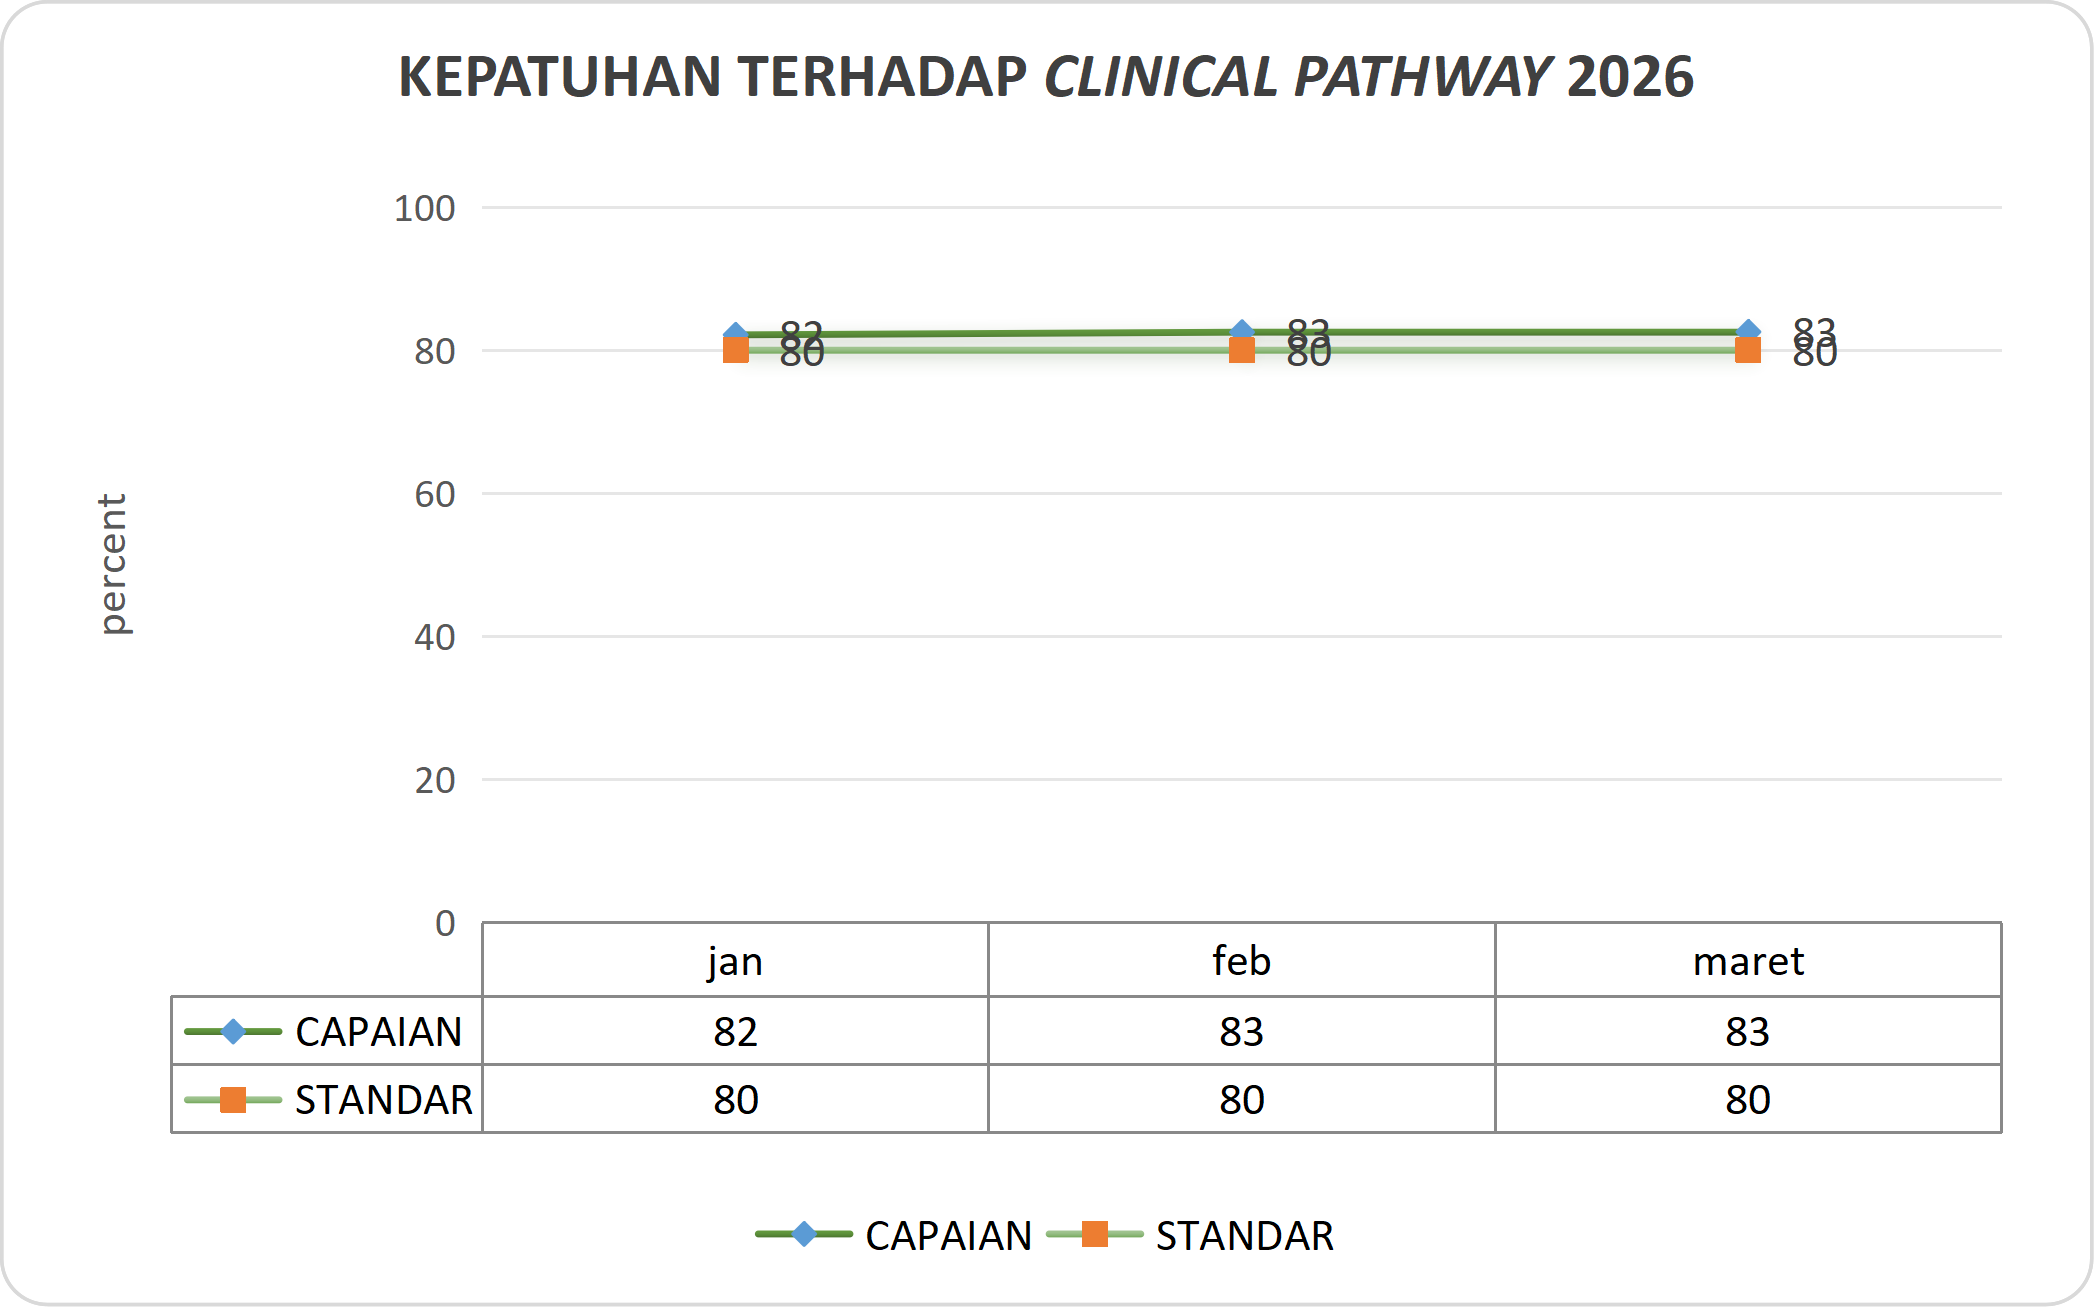
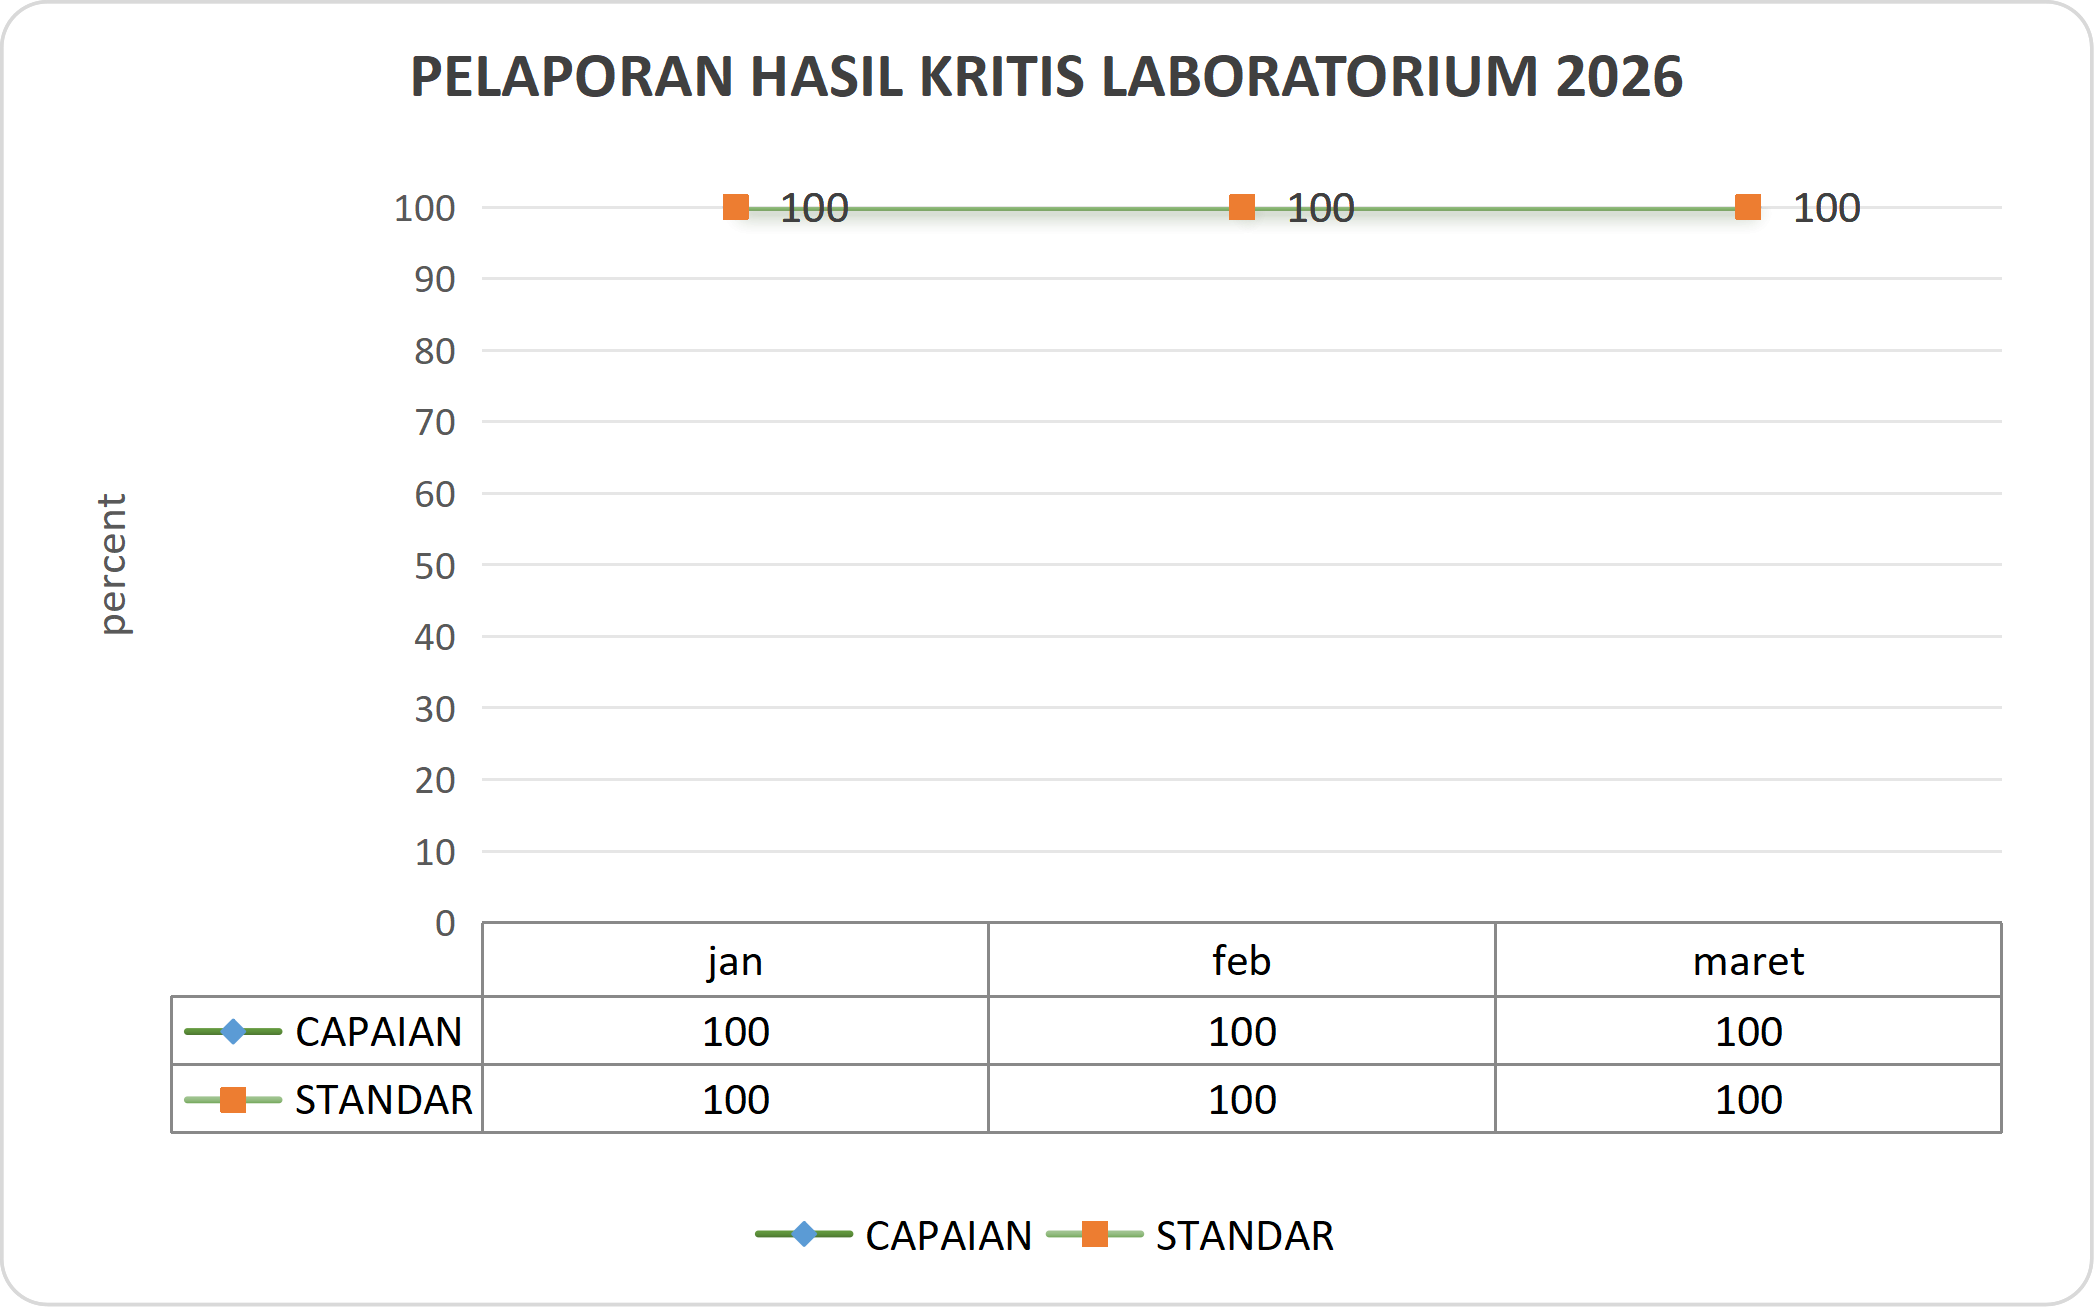
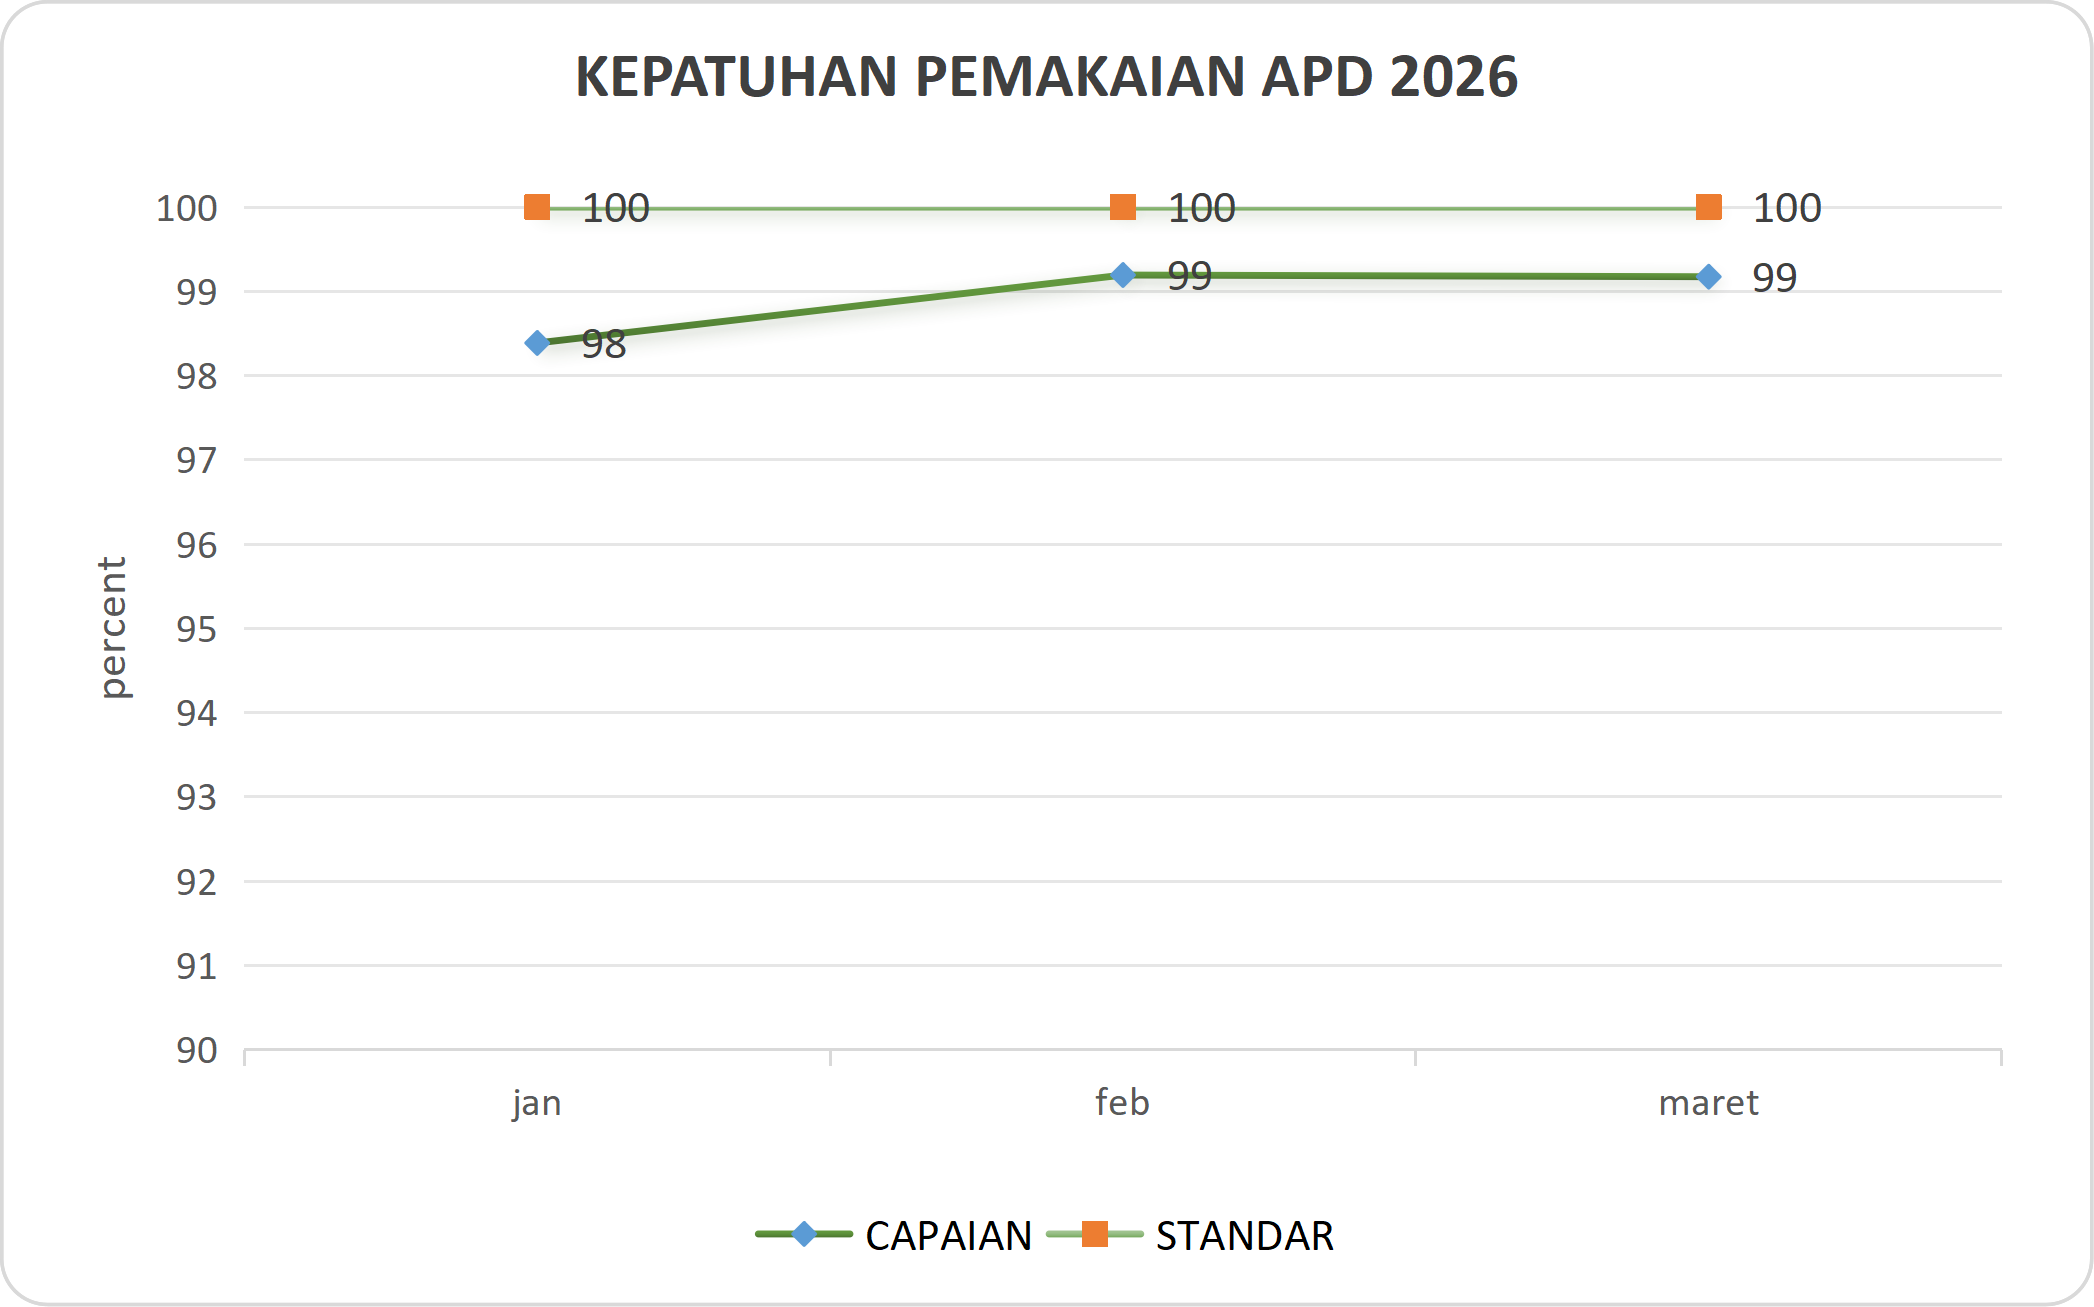
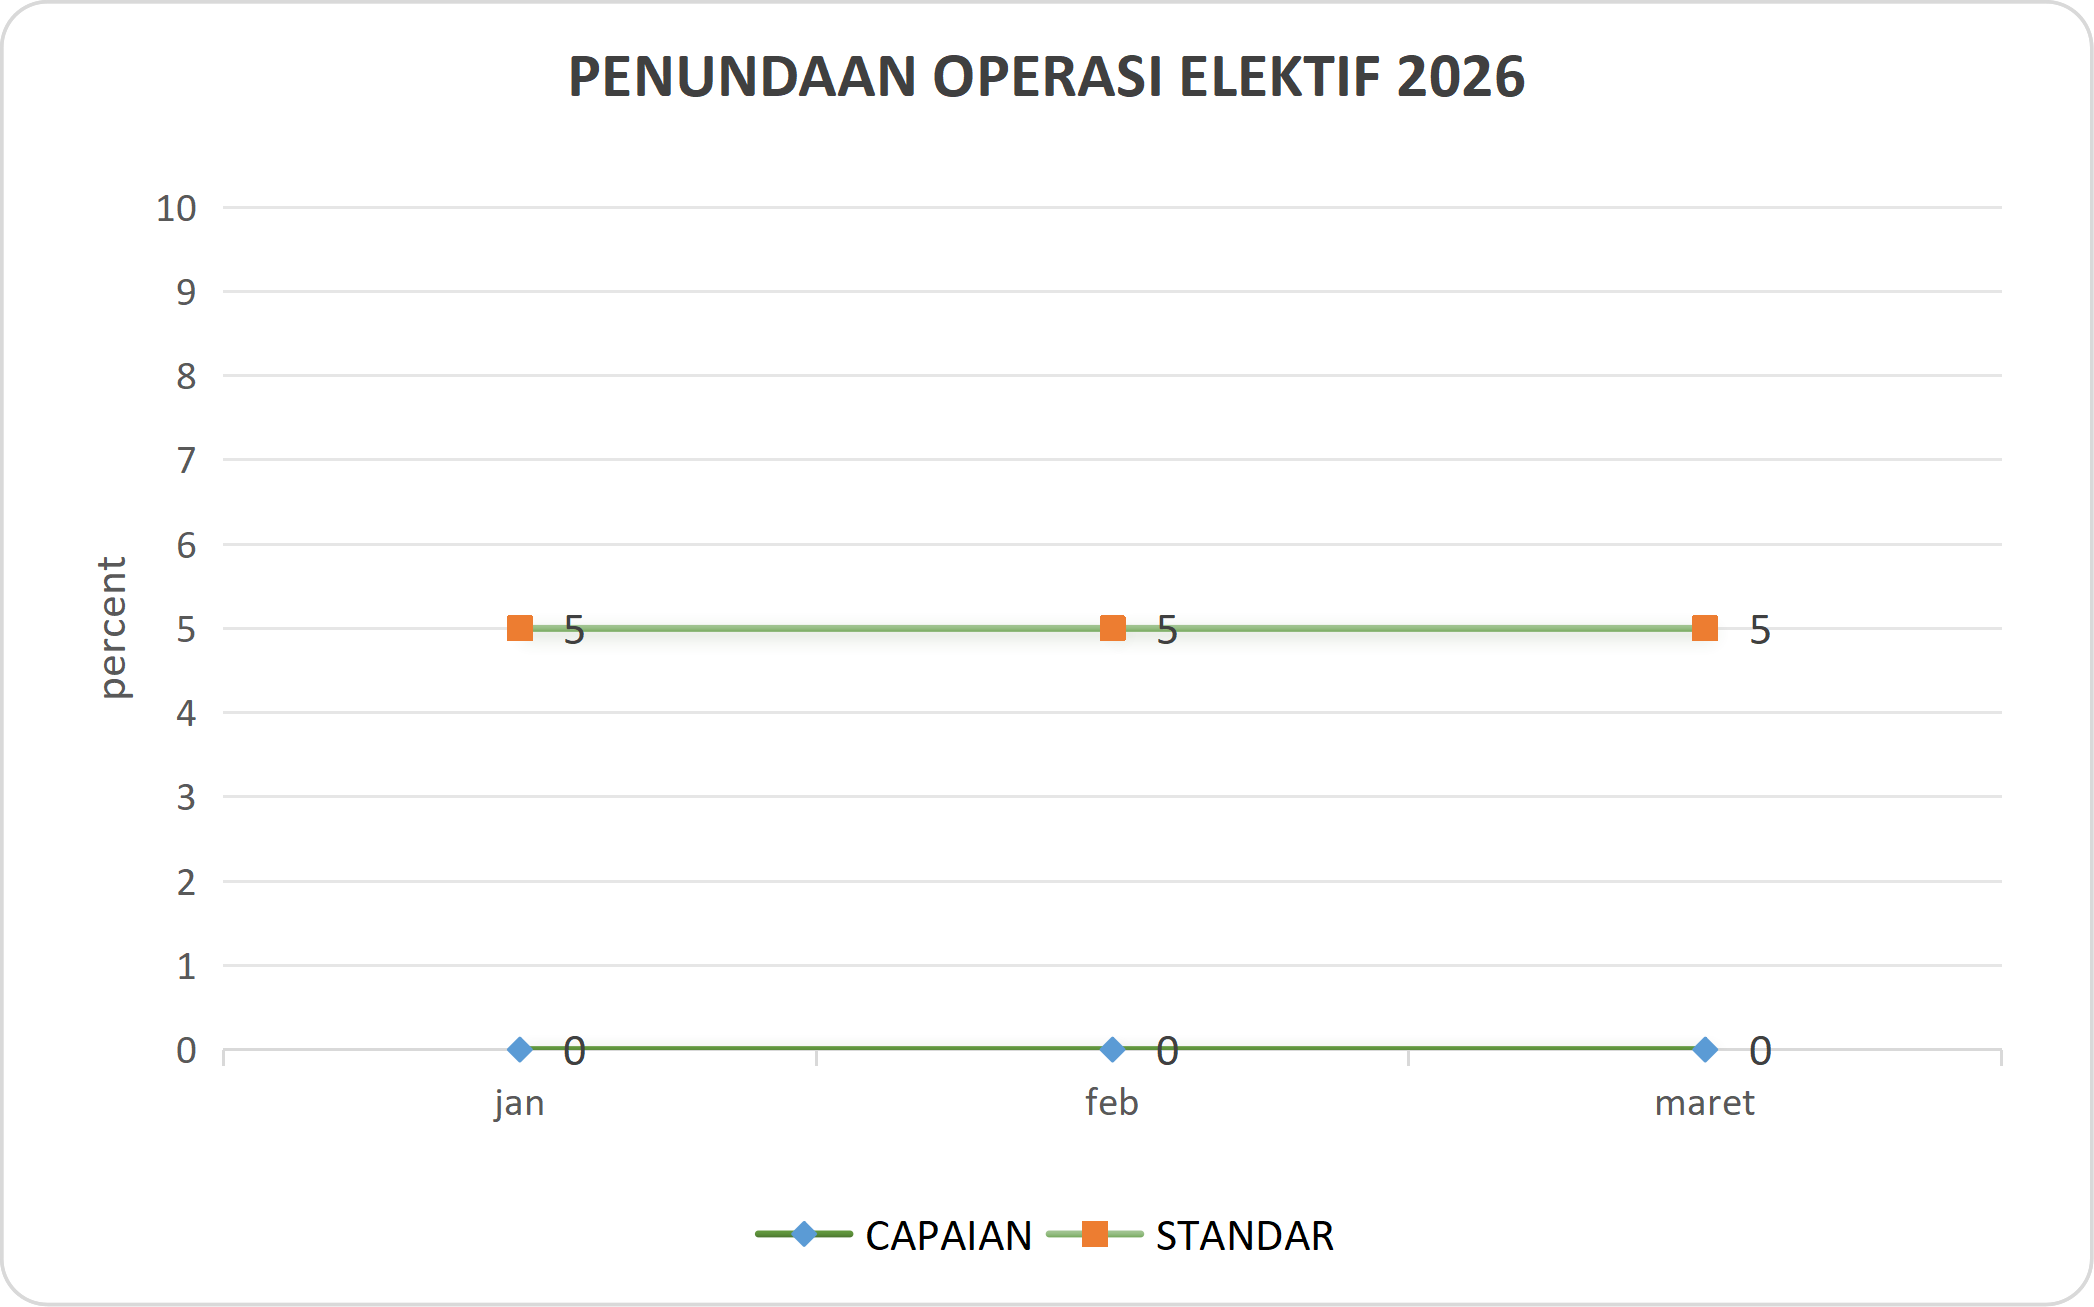
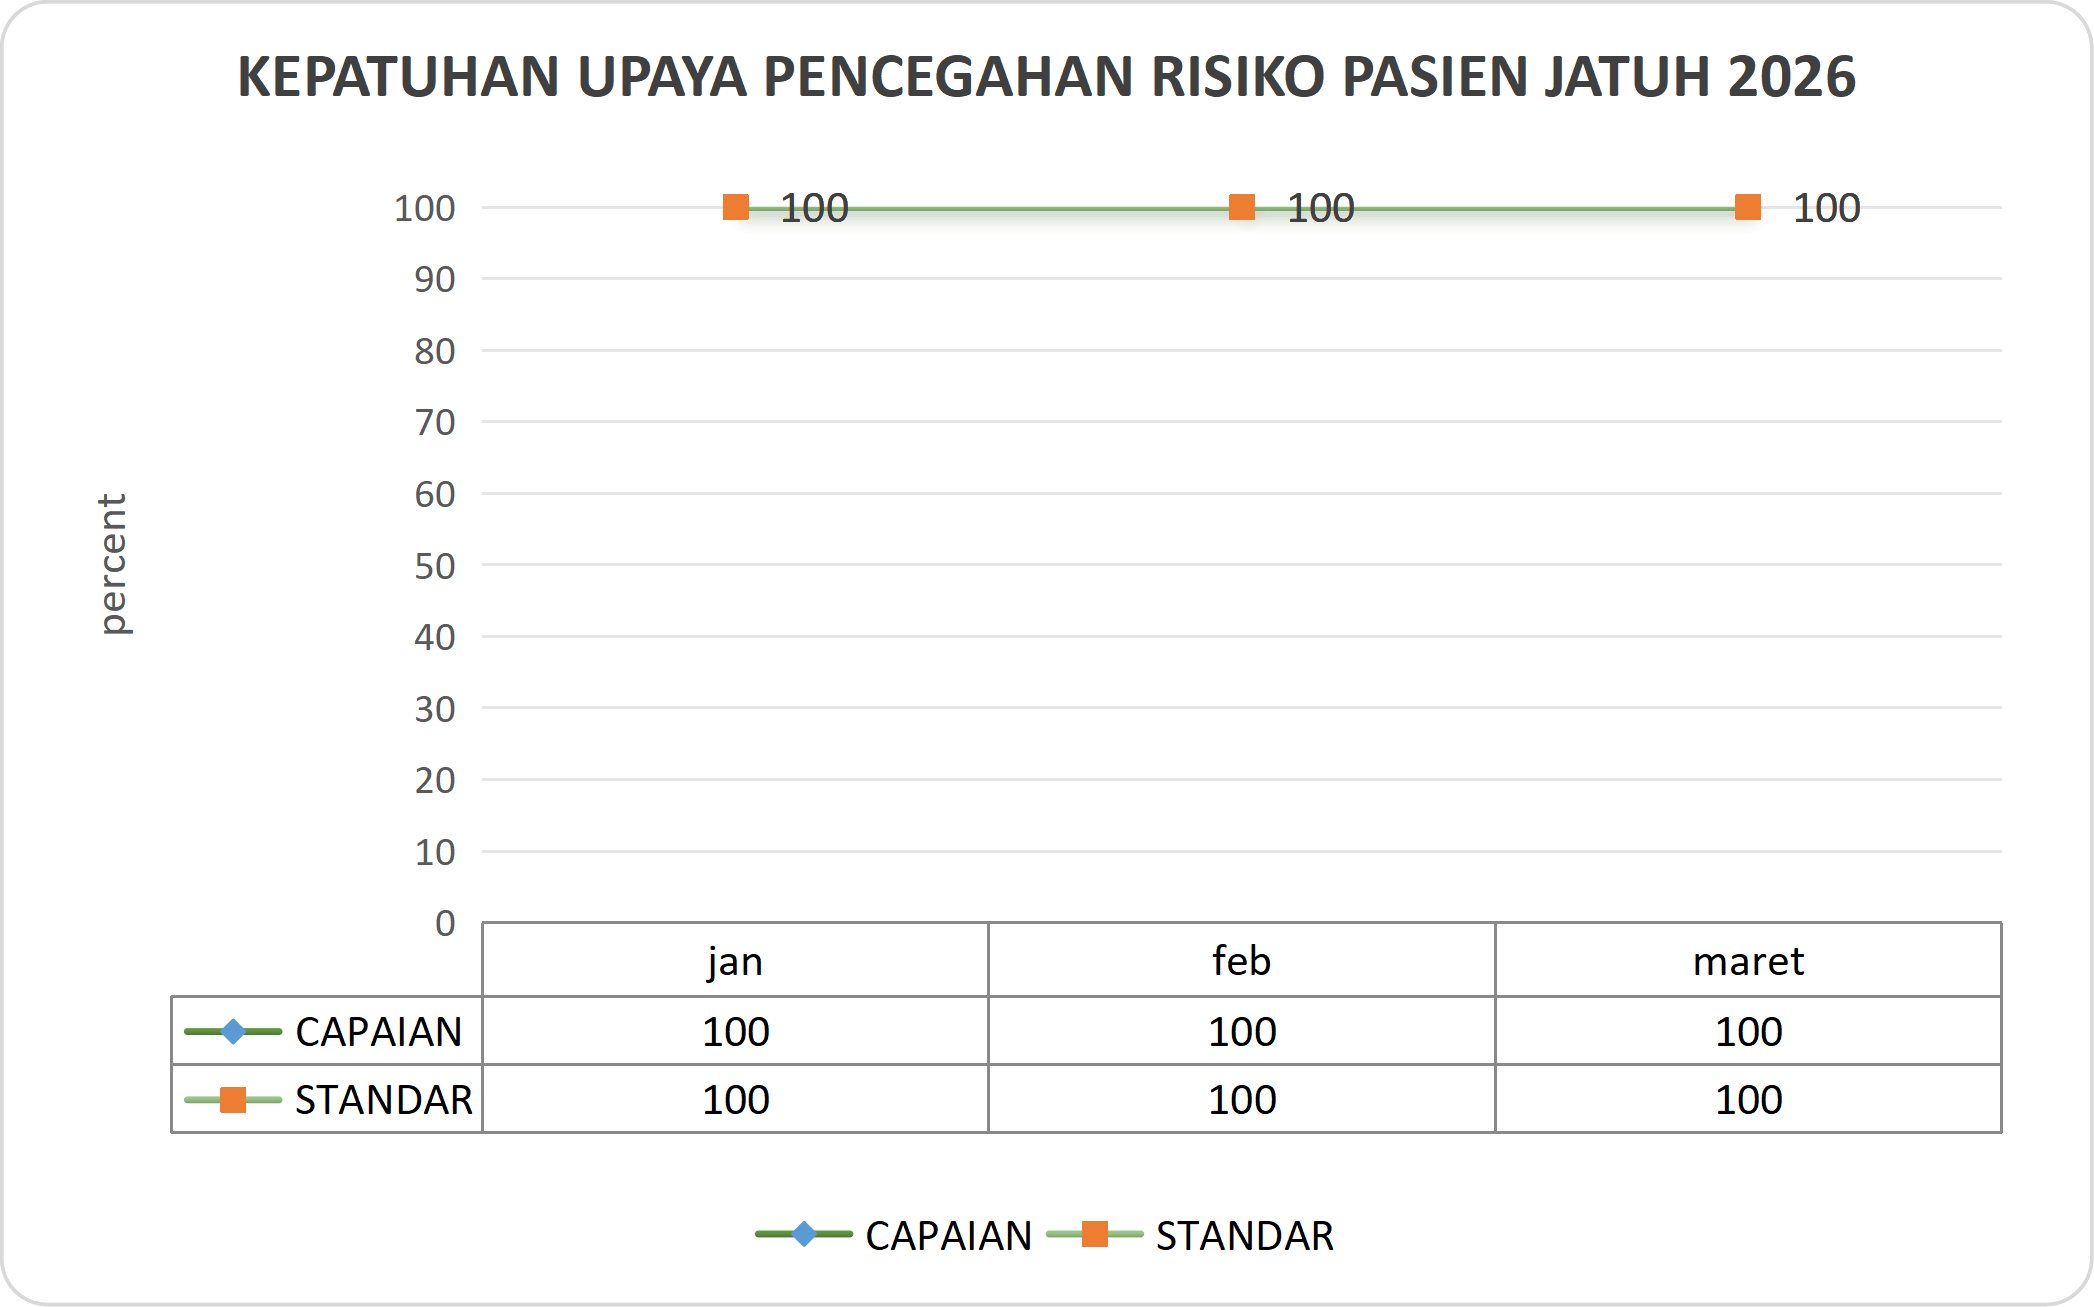
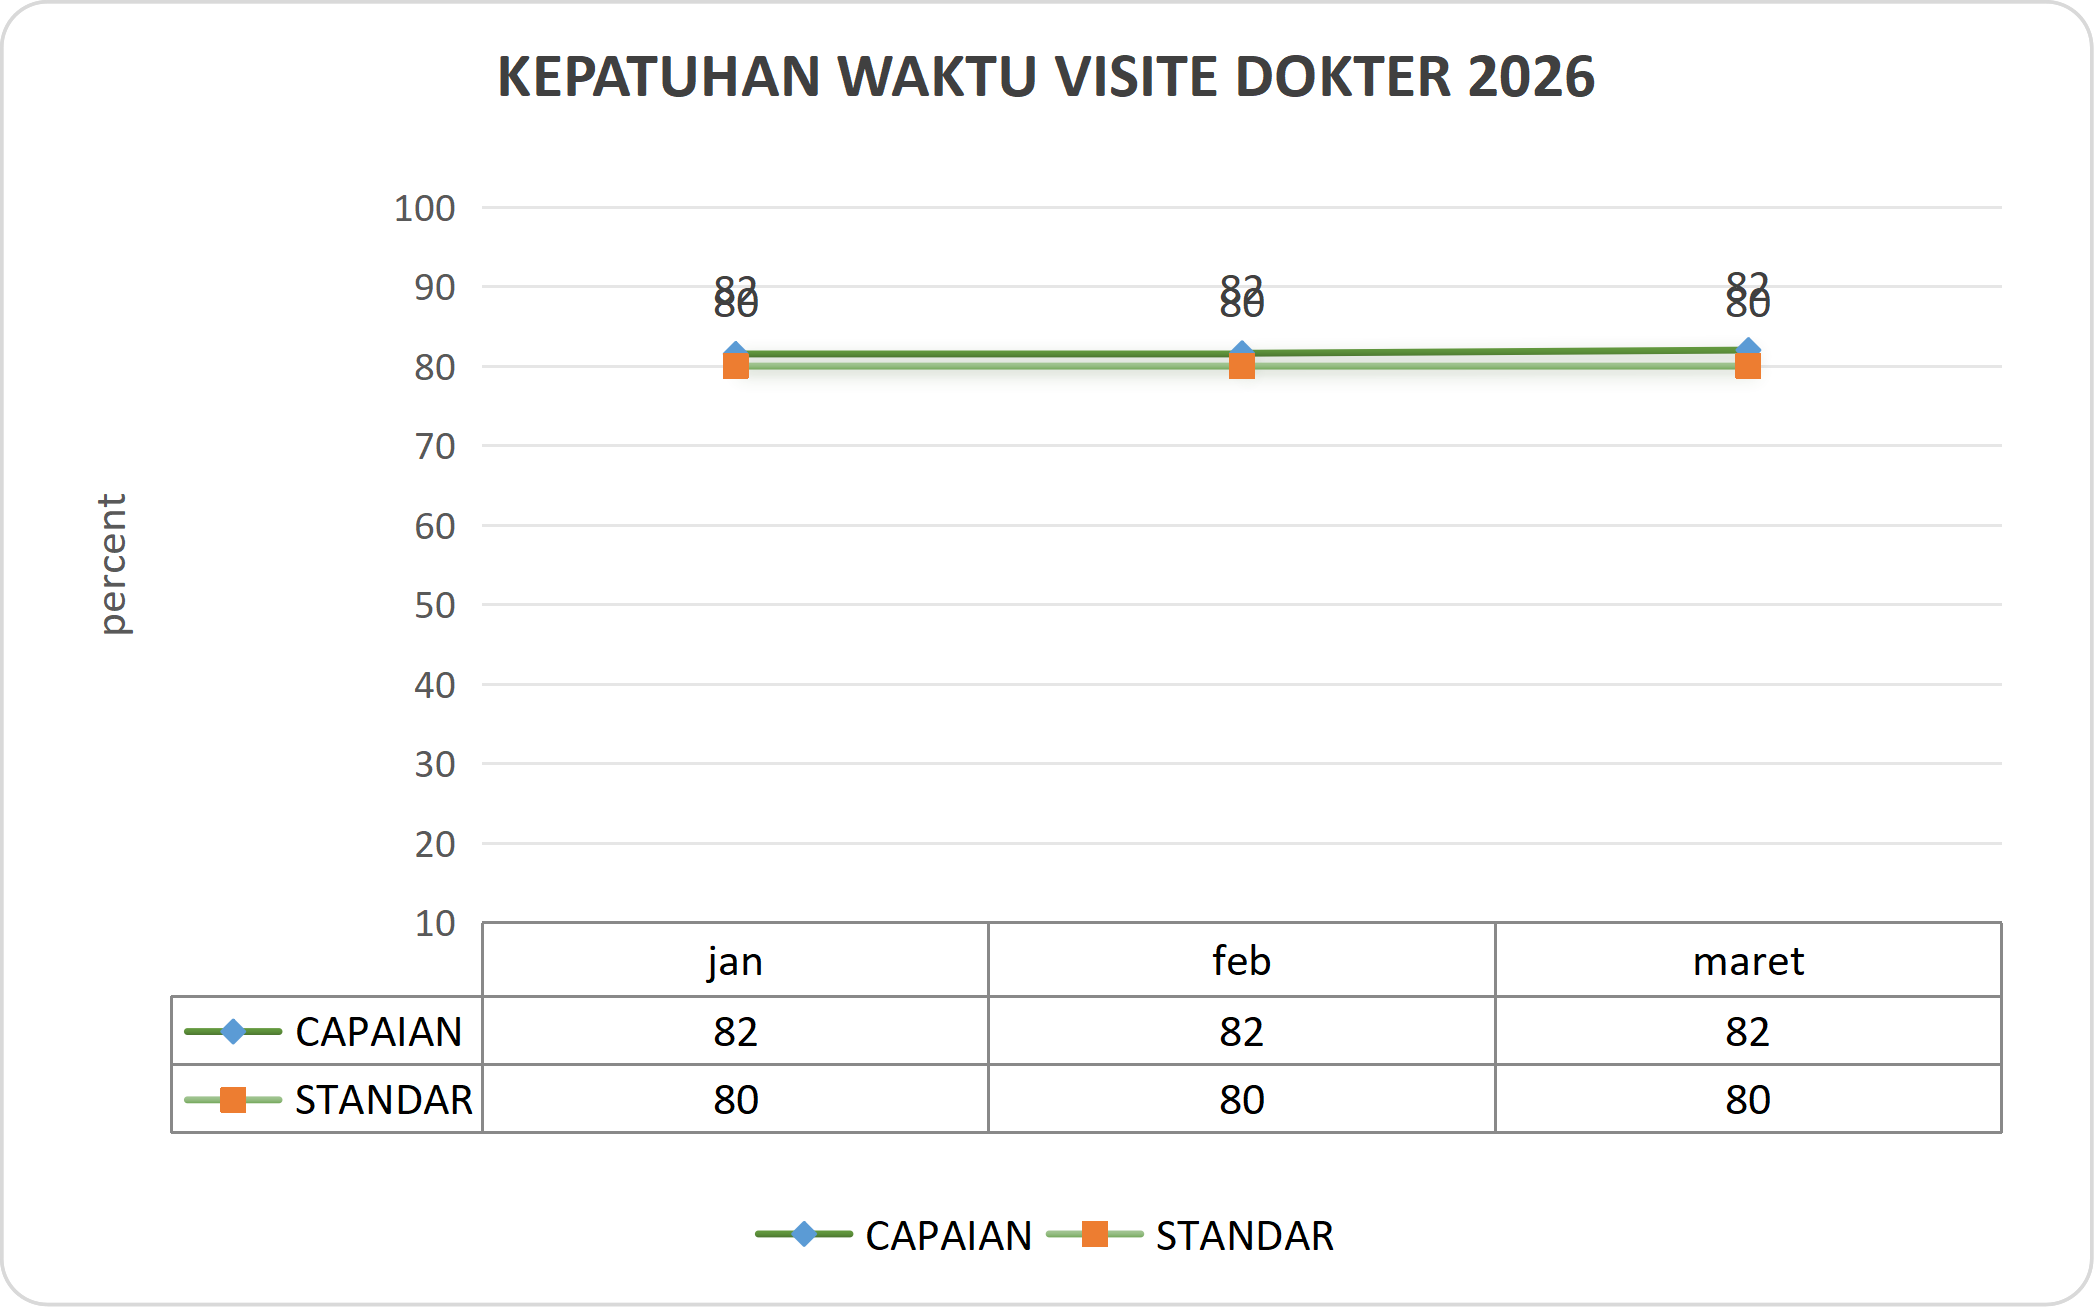
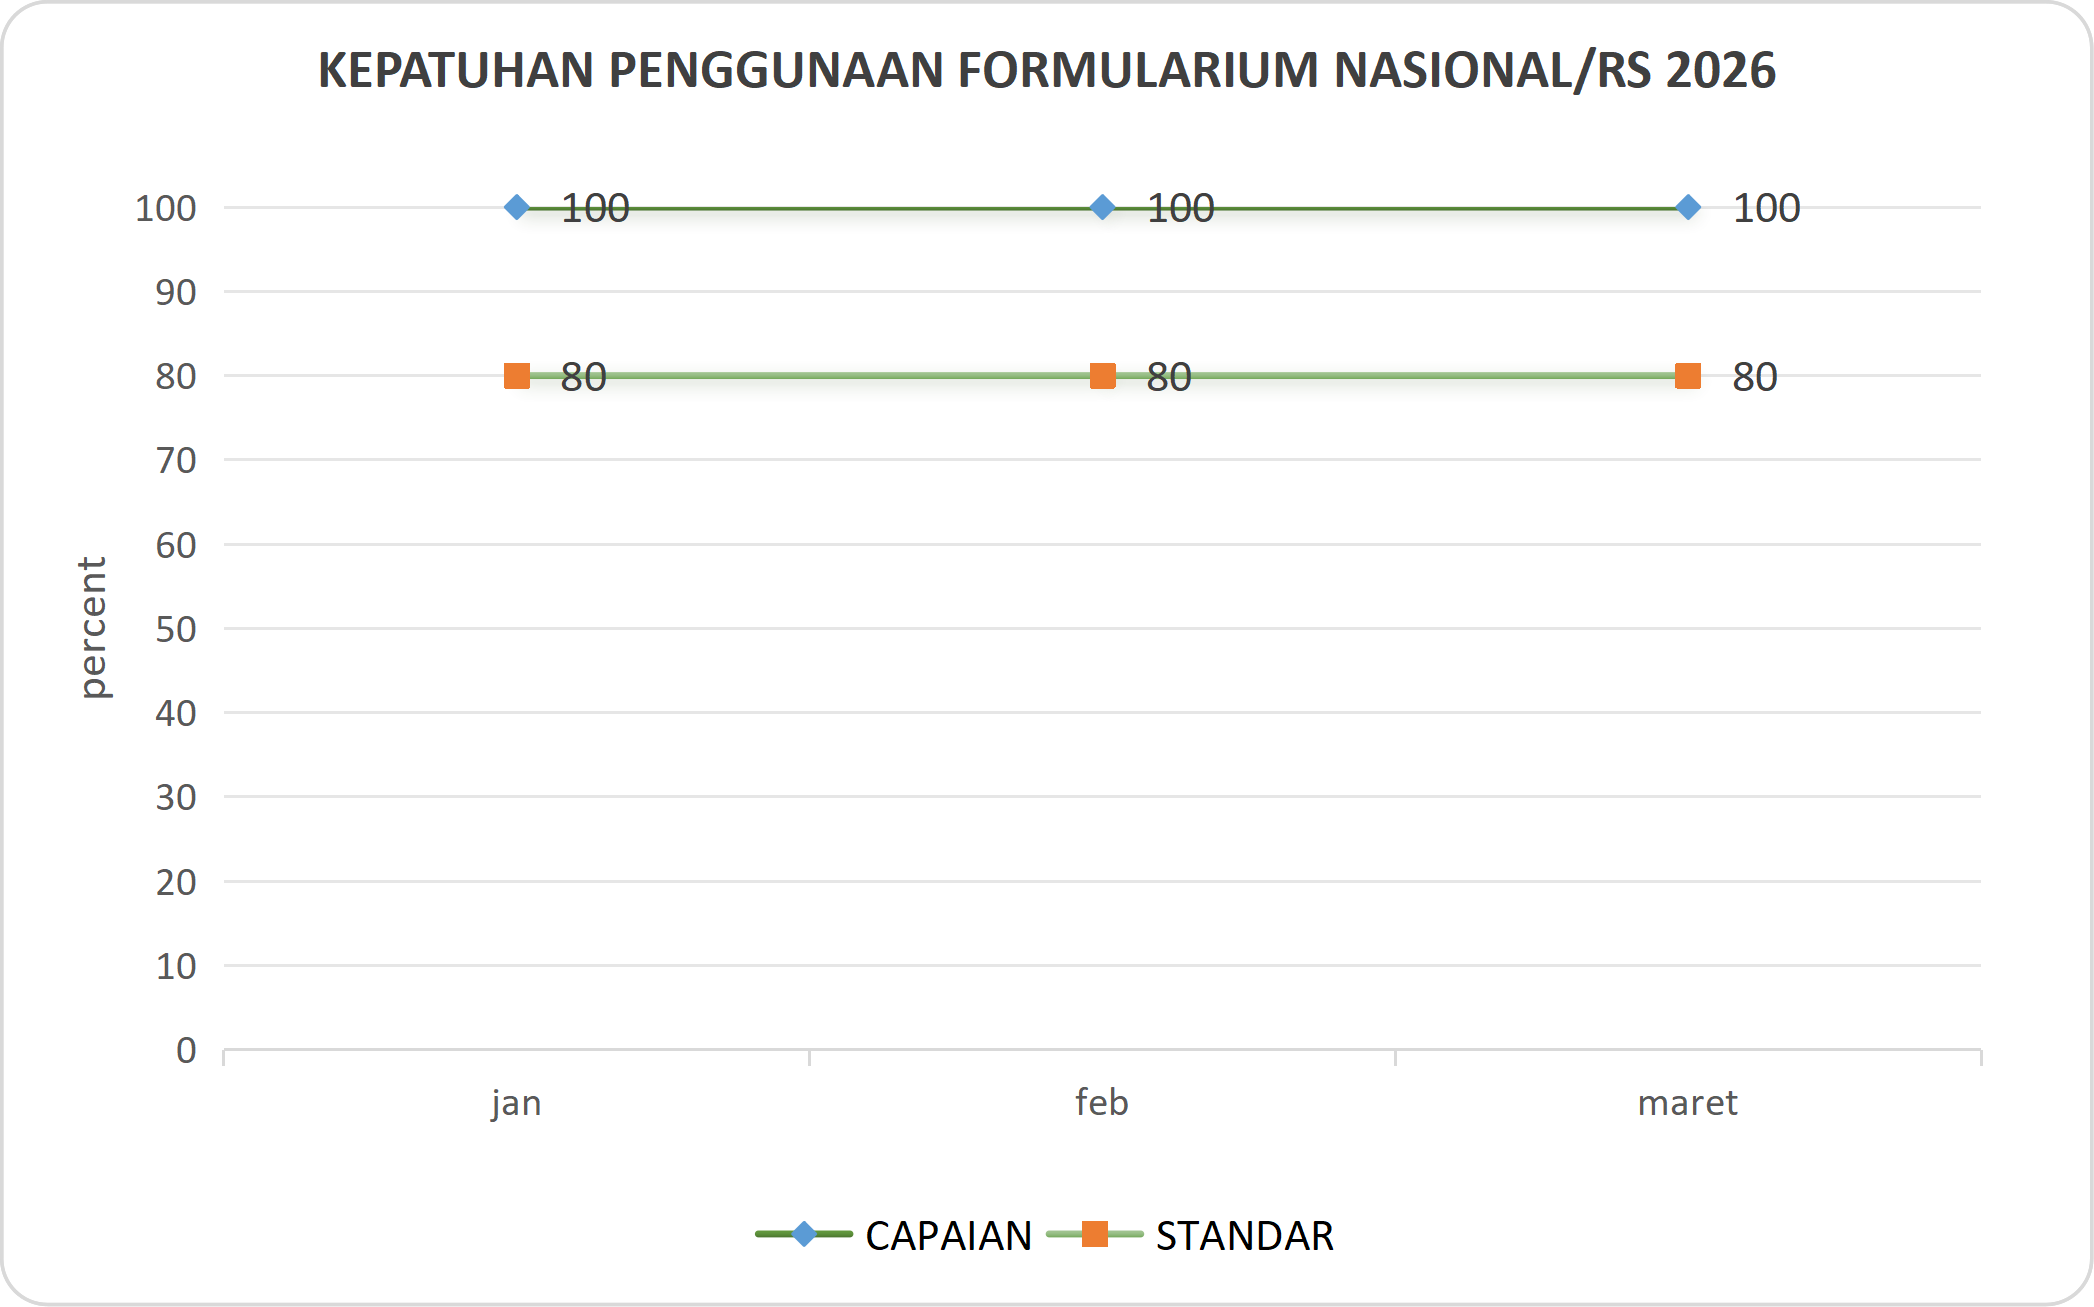
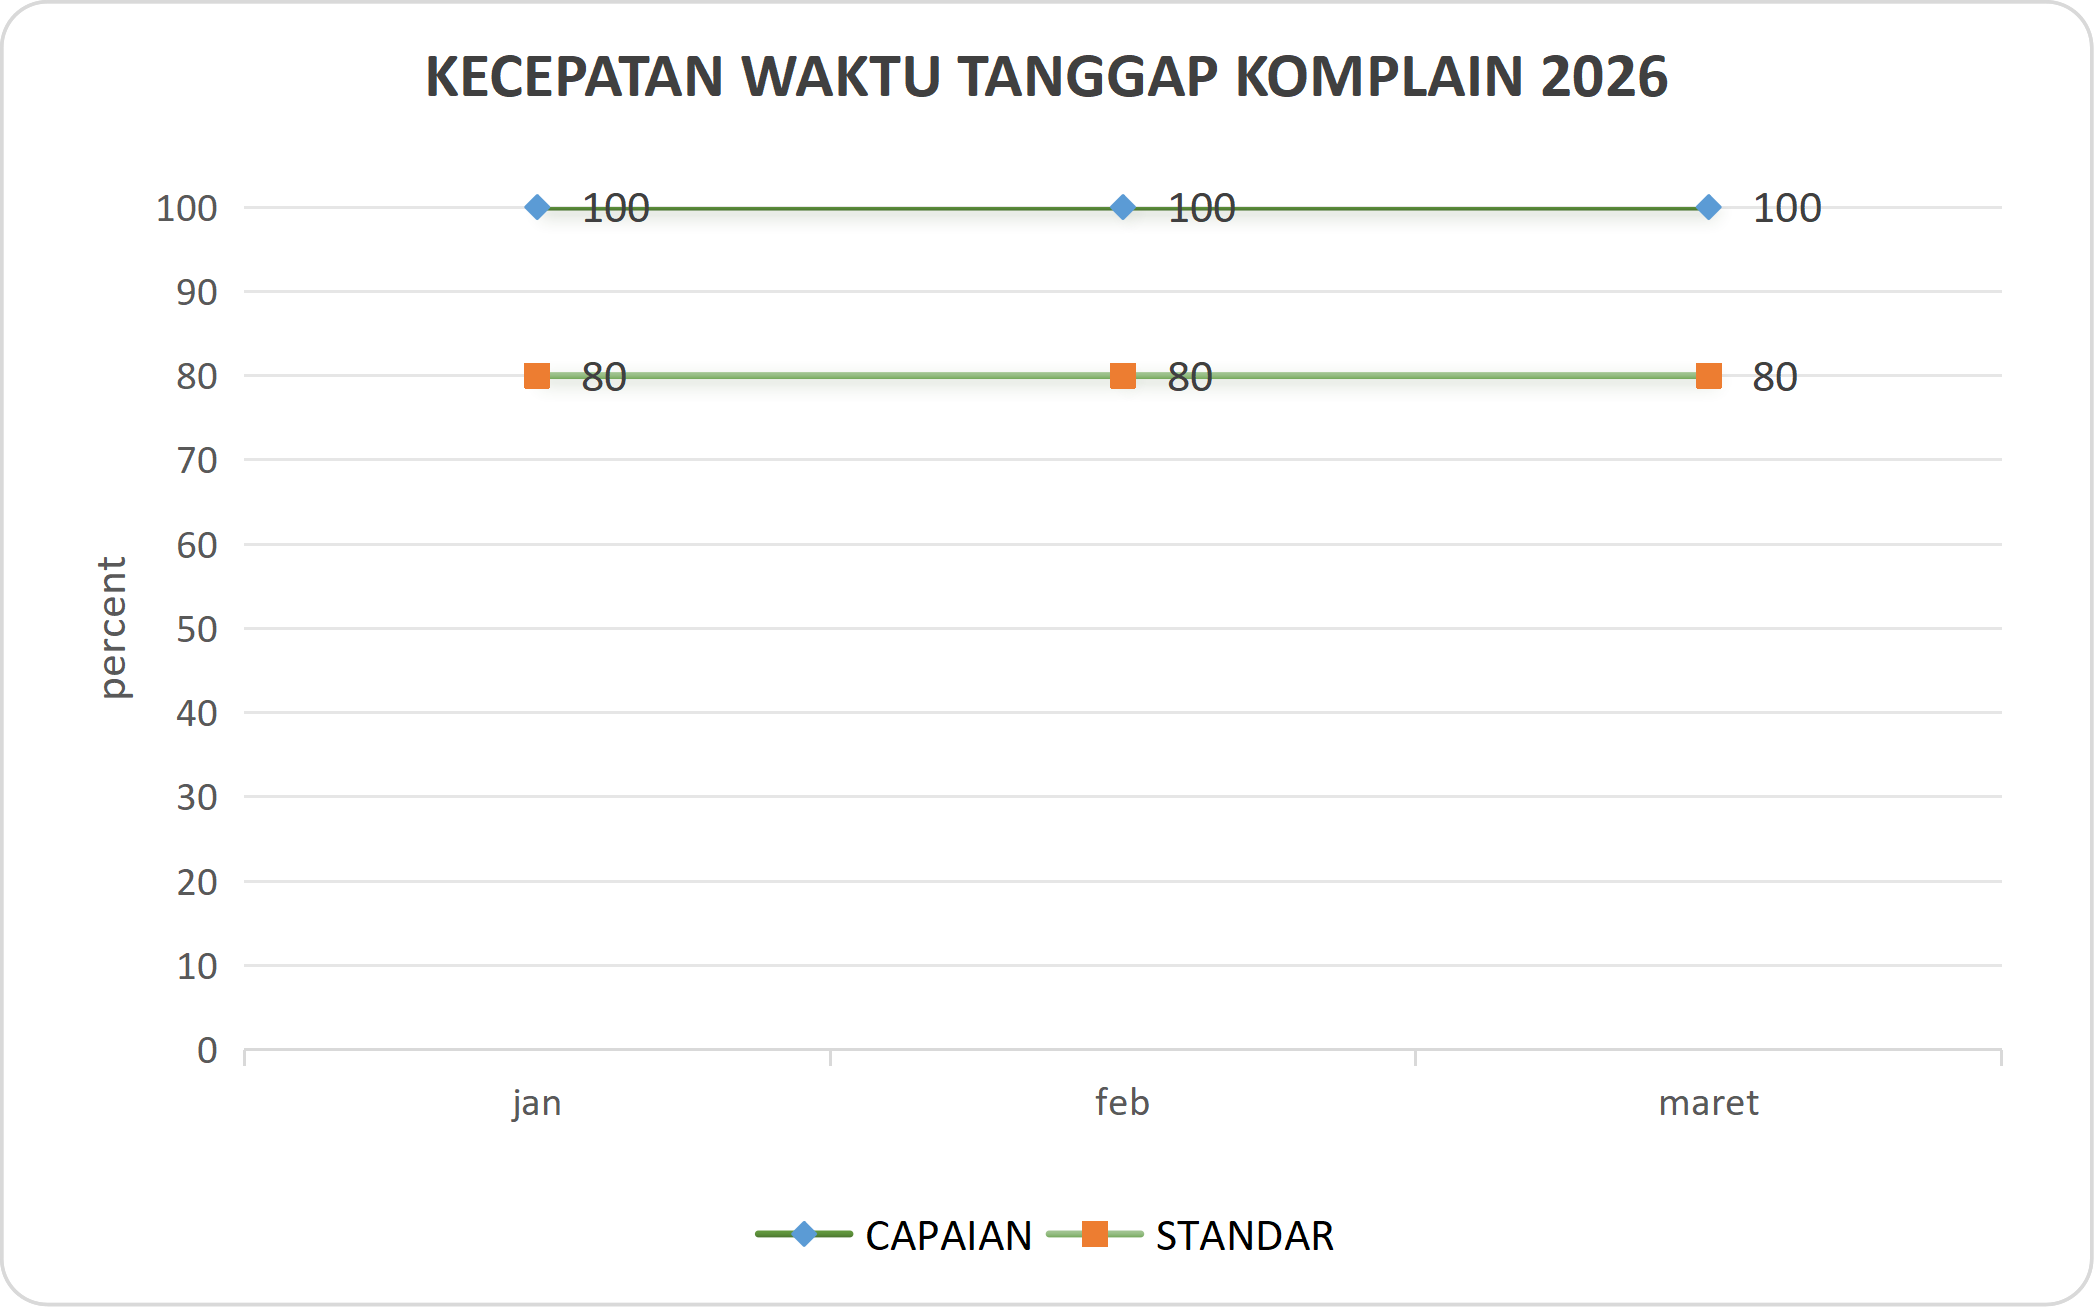
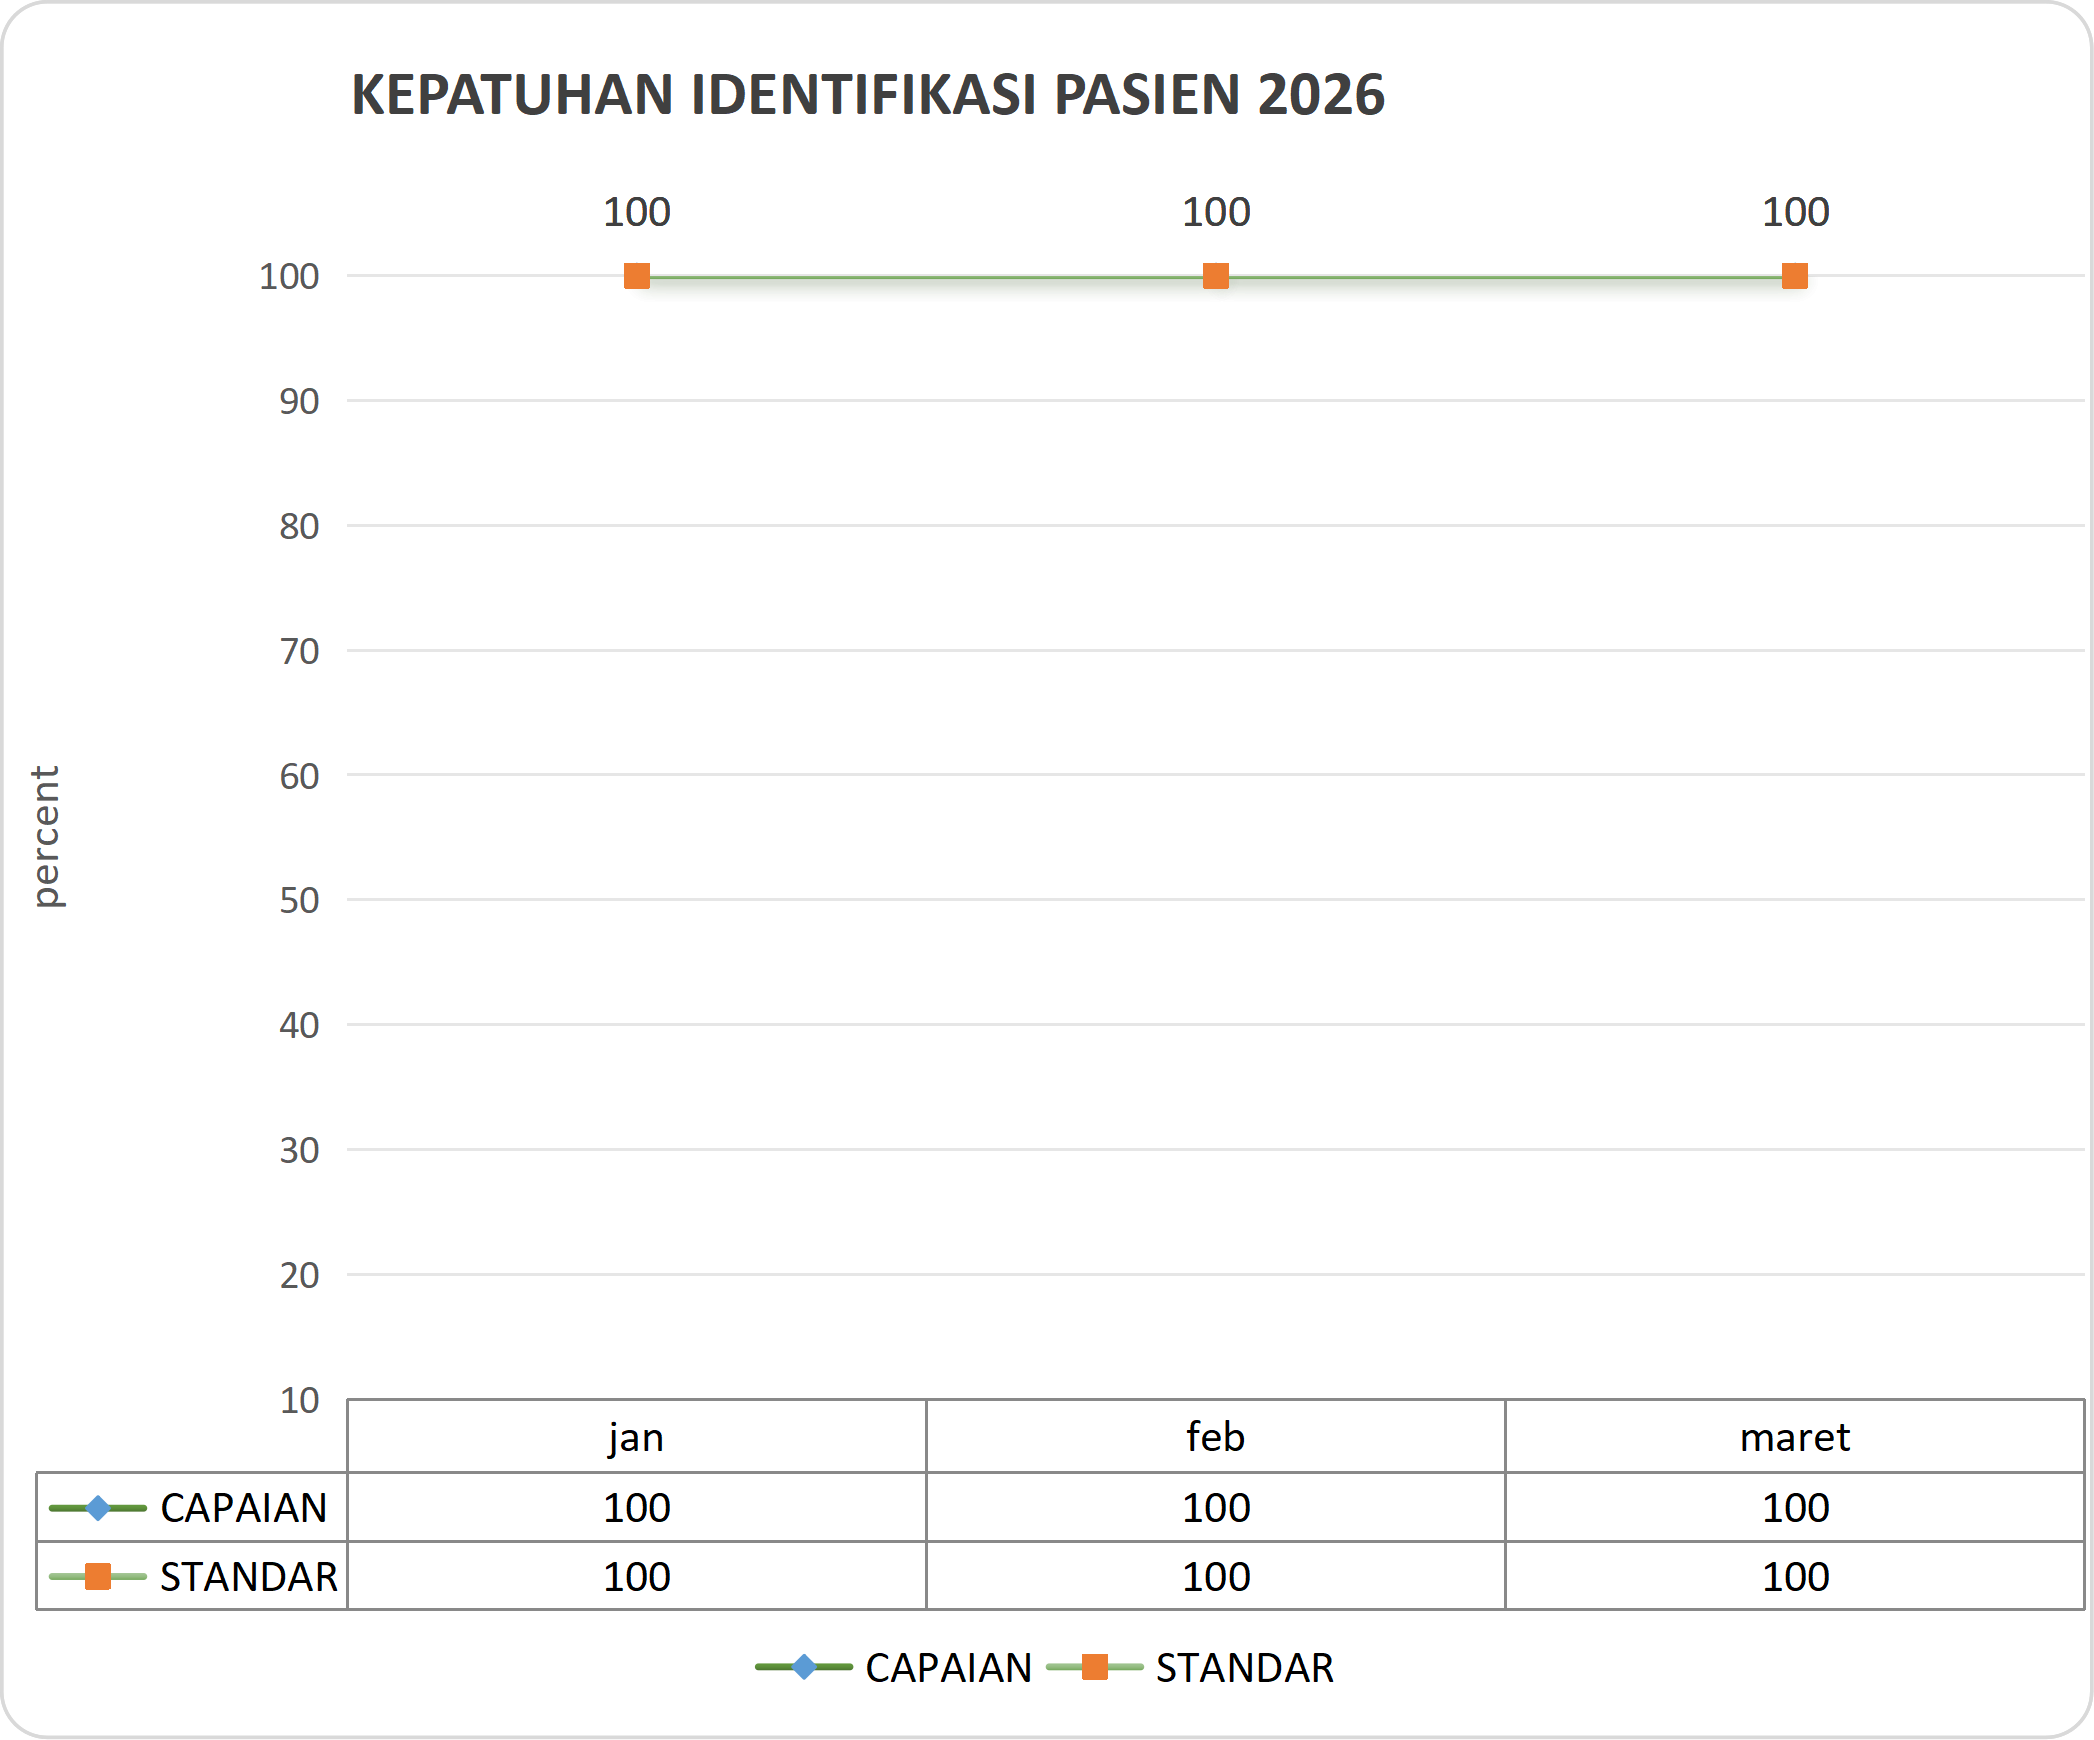
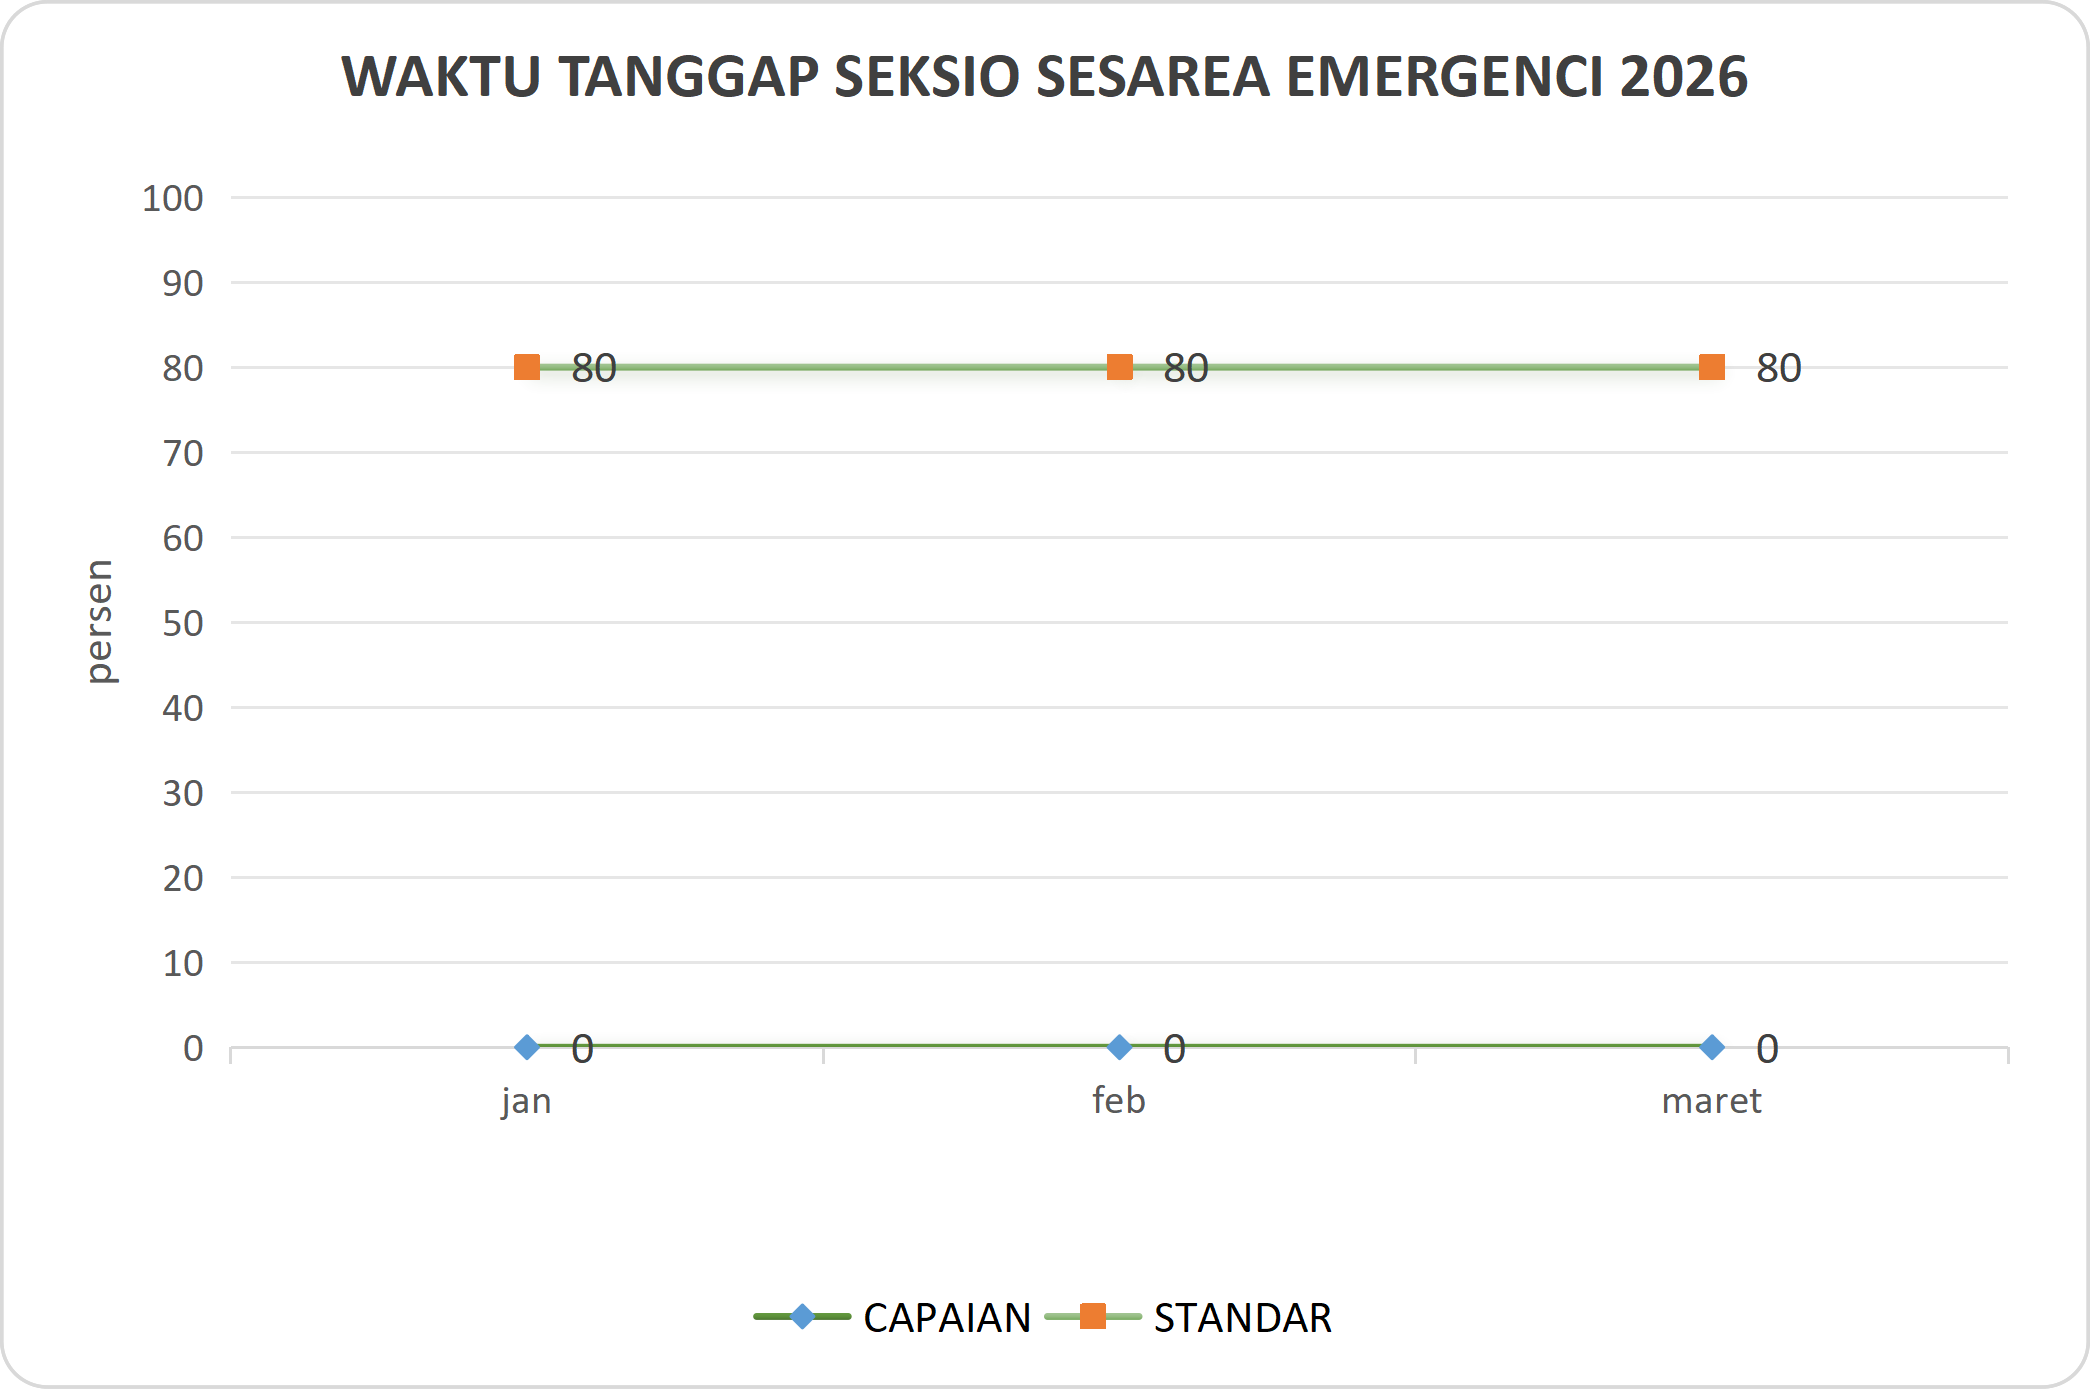
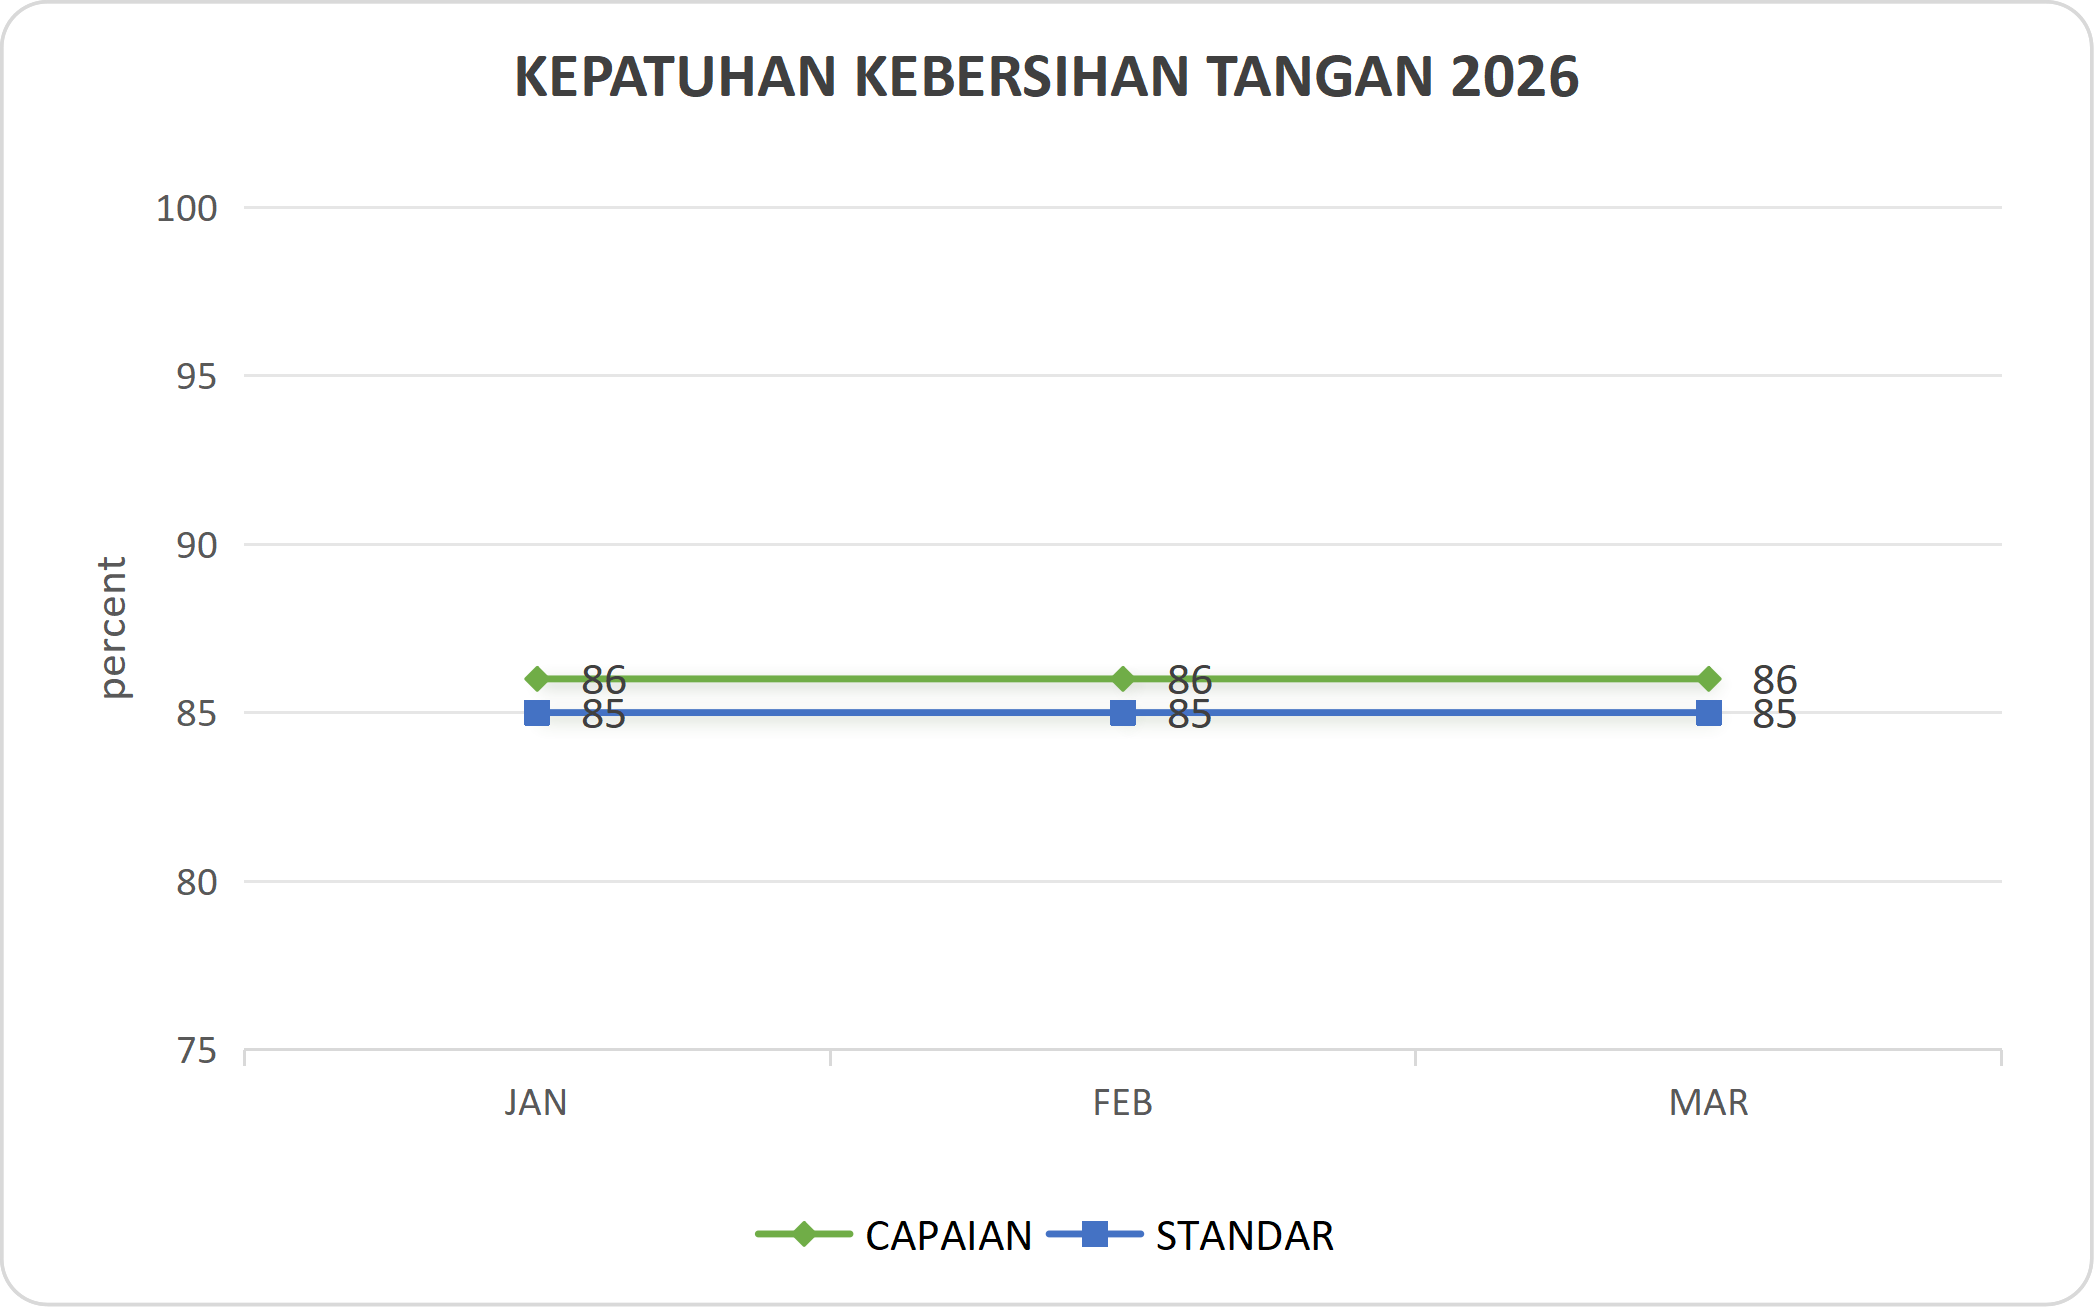
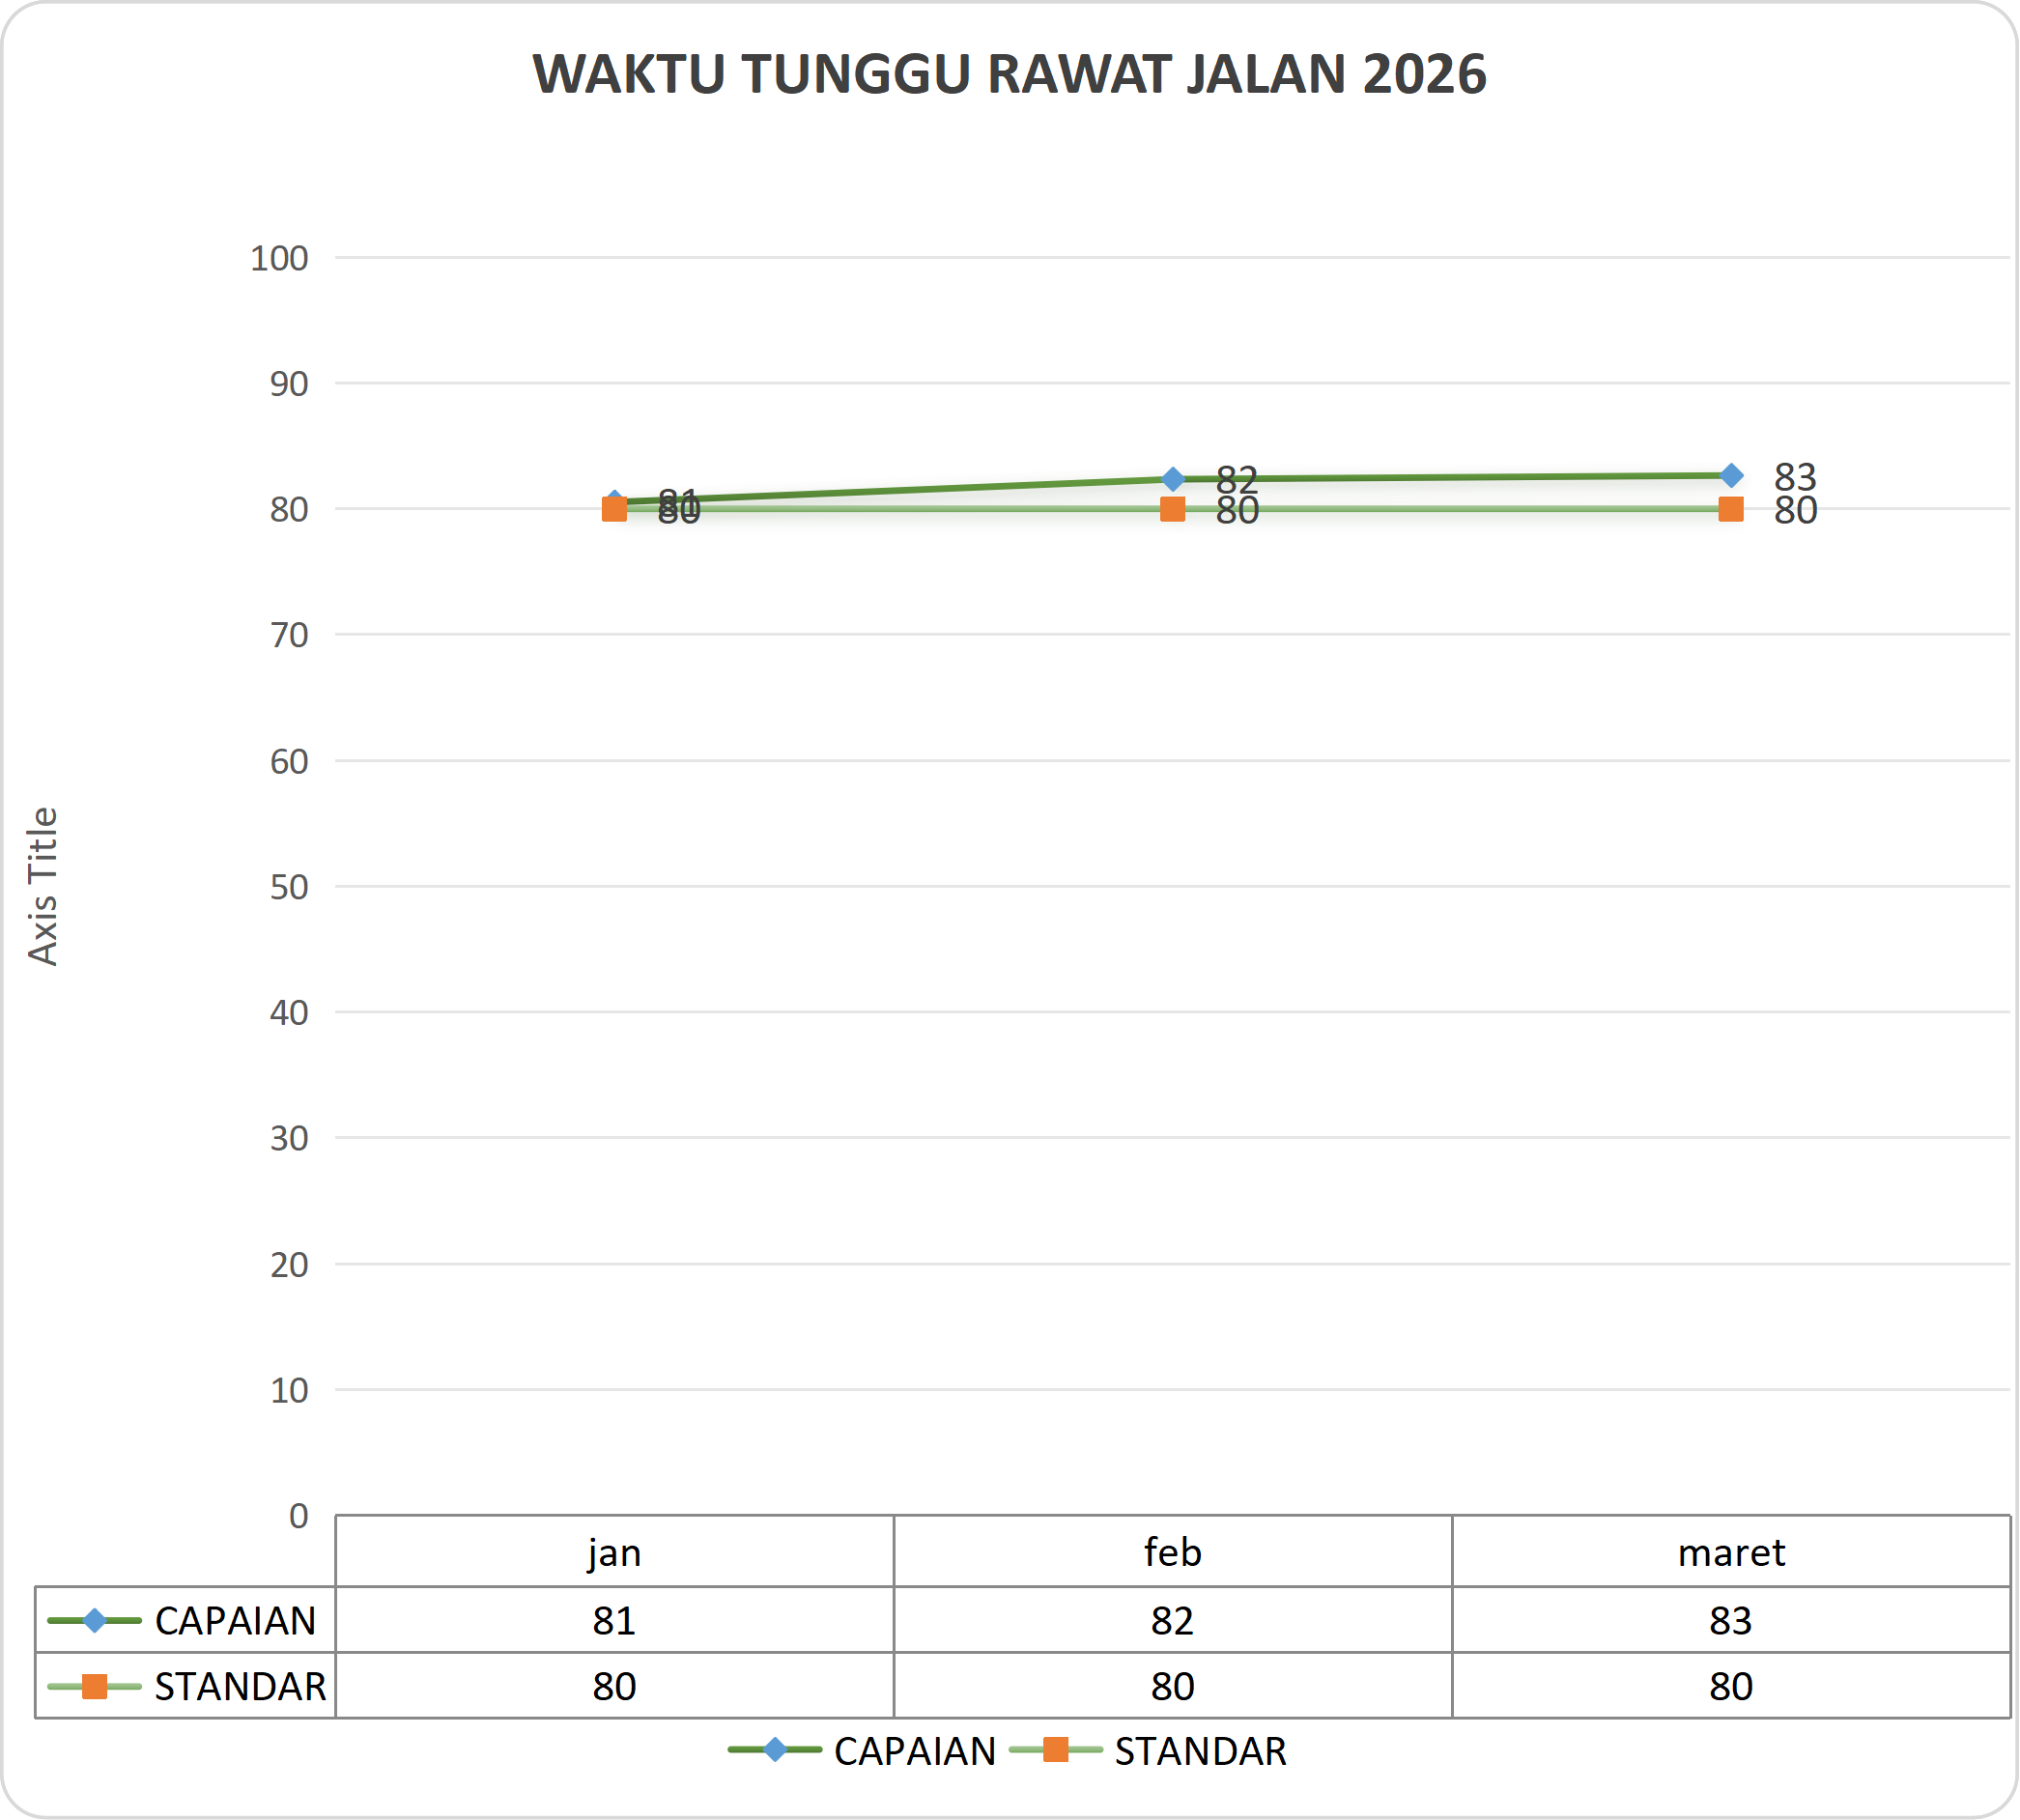
Capaian Indikator Nasional Mutu RSI Aminah Sidoarjo
Triwulan 2 (2025)

Line graph showing adherence to clinical pathway in 2025. The blue line labeled 'CAPAIAN' remains steady at 92-93% from January to June. The orange line labeled 'STANDAR' stays steady at 80% throughout the same period.
Line graph titled 'Pelaporan Hasil Kritis Laboratorium 2025' showing 100% for both 'CAPAIAN' and 'STANDAR' across January to June.
Line graph titled 'KEPATUHAN PEMAKAIAN APD 2025' showing compliance percentages from January to June for two categories, 'CAPAIAN' in blue and 'STANDAR' in orange. The compliance is nearly 99% from January to May, with a rise to 100% in June.
A line graph titled 'Penundaan Operasi Elektif 2025' shows the percentage of delay incidents for two categories, 'CAPAIAN' and 'STANDAR', from January to June. The 'CAPAIAN' line remains at 0% all months, while the 'STANDAR' line stays at 5%.
A line graph showing patient risk prevention compliance in 2025. The x-axis displays months from January to June, and the y-axis shows percentage. The blue line indicates compliance rate (CAPAIAN) and remains at 100% throughout, while the orange line shows standards (STANDAR) also at 100%.
Line graph titled 'Kepatuhan Waktu Visite Dokter 2025' showing percentage compliance for 'Capaian' and 'Standar' from January to June. 'Capaian' remains at 92%, and 'Standar' at 80%.
A line graph showing the compliance rates of the 2025 national formulary application in Indonesia, with two lines labeled 'CAPAIAN' in blue and 'STANDAR' in orange. The data spans from January to June, with both lines consistently at 100% and 80%, respectively.
Line graph titled 'KECEPATAN WAKTU TANGGAP KOMPLAIN 2025' showing response times in percentage across months from January to June. The graph has two lines: one blue representing 'CAPAIAN' consistently at 100%, and one orange representing 'STANDAR' consistently at 80%.
Line graph titled 'KEPATUHAN IDENTIFIKASI PASIEN 2025' showing 100% compliance throughout 2025, with months from January to June. The y-axis ranges from 10 to 100 percent. Two lines compare 'CAPAIAN' in blue, which varies, and 'STANDAR' in orange, maintaining 100% compliance.
Line graph titled 'WAKTU TANGGAP SEKSIOS SESAREA EMERGENSI 2025' showing response times over months January through June. The blue line (CAPAIAN) peaks at 100 in April, while the orange line (STANDAR) stays steady at 80. Response times are mostly 0 in January, February, March, May, and June, but reach 100 in April.
Line graph titled 'KEPATUHAN KEBERSIHAN TANGAN 2025' showing hand cleanliness compliance percentages from January to June. Two lines represent 'CAPAIAN' (achievement) in blue, starting at 85% and rising to 87%. The 'STANDAR' (standard) line is in orange, flat at 85%.
Line graph titled 'WAKTU TUNGGU RAWAT JALAN 2025' showing average waiting times for outpatient care from January to June. The blue line labeled 'CAPAIAN' starts at 92 in January and ends at 93 in June. The orange line labeled 'STANDAR' remains steady at 80 throughout all months.